Stories
New Data From Old Satellites: A Nimbus Success Story
› Larger view
Archaeologists hunt for relics in an effort to shed light on the past. For techno-archaeologists, these relics are data, and Dave Gallaher and Dr. Garrett Campbell are in a race against time to uncover data that have not seen the light of day in almost a half-century. They are searching for polar sea ice data collected by NASA satellites launched in the 1960s. It has been a long time since these data were collected and last seen. And time is running out.
You see, data, especially data from the 1960s and early 70s, are fragile. After 30 or 40 years the iron ferrite particles that magnetically hold bits of data can separate from the acetate holding the particles in place on the large data spools used at the time. When this happens, the data can disappear. Forever.
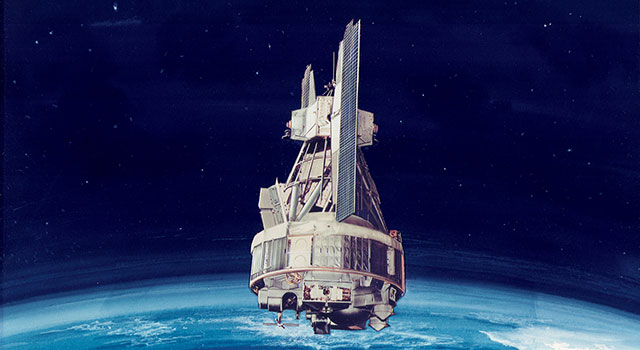
So when Gallaher heard in 2009 that scientists at NASA’s Goddard Space Flight Center (GSFC) in Greenbelt, MD, had successfully recovered high-resolution infrared radiometer (HRIR) data from NASA’s Nimbus I (1964), II (1966), and III (1969) missions, he had an idea.
“I noticed that some of the satellite swaths went over the poles,” says Gallaher, the Technical Services Manager at the National Snow and Ice Data Center (NSIDC) Distributed Active Archive Center (DAAC), the home of one of NASA’s Distributed Active Archive Centers (DAACs) specializing in snow and ice data. “I asked if they could detect sea ice with these data, because one of the major gaps we have in sea ice data is that the sea ice data record starts in 1979. Wouldn’t it be amazing if we could use the data from these early satellite missions to find out what the ice looked like and extend the sea ice record back a full 50 years?”
More than five years later, after manually searching through more than a quarter-million individual Nimbus images with a small team using equipment that is no longer manufactured, these early polar sea ice data are now available at the touch of a button. This is a data success story; a story about bringing dark data back into the light.
Sensing the 60s
From the viewpoint of the 21st century, when a cell phone has more processing power than the computers that helped land astronauts on the moon, it is easy to look back and ask why the data from these early satellite missions were not actively processed, analyzed, and stored as an integral part of the climate record.
As Campbell, the NSIDC scientist who worked with Gallaher on the Nimbus data recovery effort, notes, the primary objective of these early satellite missions was not to collect long-term climate data. “Climate monitoring from satellites really didn’t get started until the mid- to late-70s,” he says. “The original NASA instruments and missions were more engineering missions to figure out how to make measurements and get them distributed the day they were taken so you could look at that day’s weather. The idea of a climate trend or keeping long-term climate records just wasn’t understood as a standard practice back then.”
In addition, the computers of the mid-1960s and early-1970s simply did not have the power to efficiently process and store the amount of data these missions produced. “The Nimbus user guide from 1966 says that this data set is so large and so vast that no one will ever be able to look at all of it,” says Gallaher. “In order to process these data, they had to print out photos and lay them out on a gymnasium floor. This was the only way to look at this stuff. It was hard! At the time, NASA played the data back over a TV screen and took pictures of the TV screen and this became the archival record.”

› Larger view
Finally, the Earth’s climate simply was not understood as well. “These records occur really before CO2 and global warming really got going,” Campbell says. “El Niño had been scientifically described, it was a known event, but the causes were not well-researched. Even the ozone hole [over Antarctica] happened after these data.”
As a consequence, the spools of data from Nimbus along with 70mm reels of film with hundreds of thousands of images were boxed up after the individual missions ended and sent to government warehouses in Maryland and North Carolina. The Nimbus data were never lost, but, as Gallaher observes, they became “dark.” “This means that the data are there, but you can’t easily use them,” he says. “Remember, the Nimbus images are just images; there’s a time stamp on them, but that’s it. In order to make any sense of the Nimbus data, you had to be able to put the data back in their correct order to determine what the image showed.”
Even when confronted with this reality, Gallaher and Campbell realized that if they could get the Nimbus polar data this could add 10 to 15 years to the sea ice data record. By 2009, the National Oceanic and Atmospheric Administration (NOAA) had ownership of the Nimbus data collection, and Gallaher contacted them to request the polar data.
The Challenges of “Dark” Data
“I called down to NOAA and asked them to send us Greenland and Antarctica,” recalls Gallaher. “There was a pause at the other end of the line and the NOAA representative said I didn’t understand. And I said, you have these data, I have the document that says you have these data. And he said, yes, we have these data, but the data are in boxes, the boxes have canisters, each canister has about 200 feet of film in it, and it’s by orbit. We don’t have any idea what’s on that film. Oh, and these canisters have been sealed for at least 40 to 50 years.”
The only way Gallaher and Campbell could get the images they wanted was to scan all of the data and look at each individual frame of film, more than 250,000 images.
Gallaher notes that while many people had inquired about the data, no one wanted to take any of the data after hearing about the state the data were in. “These data were inherently dark data—they were too tough to use to be of any value,” he says.
But Gallaher and Campbell, along with their NSIDC colleague Dr. Walt Meier, a sea ice specialist and currently a research scientist at the GSFC Cryospheric Sciences Laboratory, knew the Nimbus data could answer many questions about polar sea ice and, perhaps, solve some mysteries in the process.
“The current sea ice record starts in 1979, right about when temperatures are really starting to rise and we’re beginning to see the downward trend in Arctic ice starting to hit,” Meier says. “The Nimbus data come in at 1964, so it extends our record back another 10 to 15 years. Nimbus really fills in the gaps.”
And there are a lot of gaps in sea ice data. Prior to the late-1970s, polar sea ice records were spotty at best. “There are no records in the 1960s and even for much of the 1970s of where the sea ice was—not from the Air Force, not from anybody,” Gallaher says. “The Russians had some ships that tried to take a stab at this for a few months at a time, but it is really incomplete data.”
With funding from a small grant through the Innovative Research Program (IRP) at the Cooperative Institute for Research in Environmental Studies (CIRES), Gallaher and Campbell broke the seals on the canisters and began to reconstruct the Nimbus sea ice record.
Bringing Nimbus Dark Data Back into the Light
After an initial assessment of the tapes and images, Gallaher and Campbell still were not sure whether the data would be useful. While each image had a time stamp, it was almost impossible to determine the location of specific images without orbital information. Then they caught a lucky break. As it turns out, the North American Aerospace Defense Command (NORAD) still had the Nimbus orbital data from the 1960s. This was the Rosetta Stone Gallaher and Campbell needed. “If you know the orbit and you know the time, you can figure out what the satellite was looking at,” explains Gallaher.
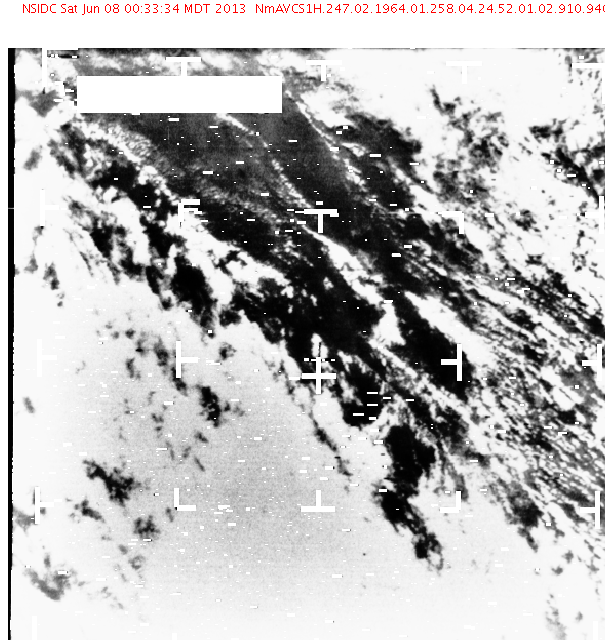
Now it was time to use the Nimbus images to determine the ice edge. However, this was easier said than done. Unlike sea ice data collected in the later 1970s and through today that use passive microwave sensors, the Nimbus data are visible images. This distinction is important. Passive microwave sensors detect energy radiated from Earth and are able to produce images based on this radiated energy independent of a source of illumination (such as the sun) or a barrier between the sensor and the ground (such as clouds). Visible images, on the other hand, require a source of illumination—an obvious hindrance during the dark polar winter—and cannot “see” through clouds. “Cloud cover is a major factor,” says Meier. “Cloud cover of 80% of the region is not uncommon. You’re really limited to the amount of data you can get compared with the passive microwave sensor.”
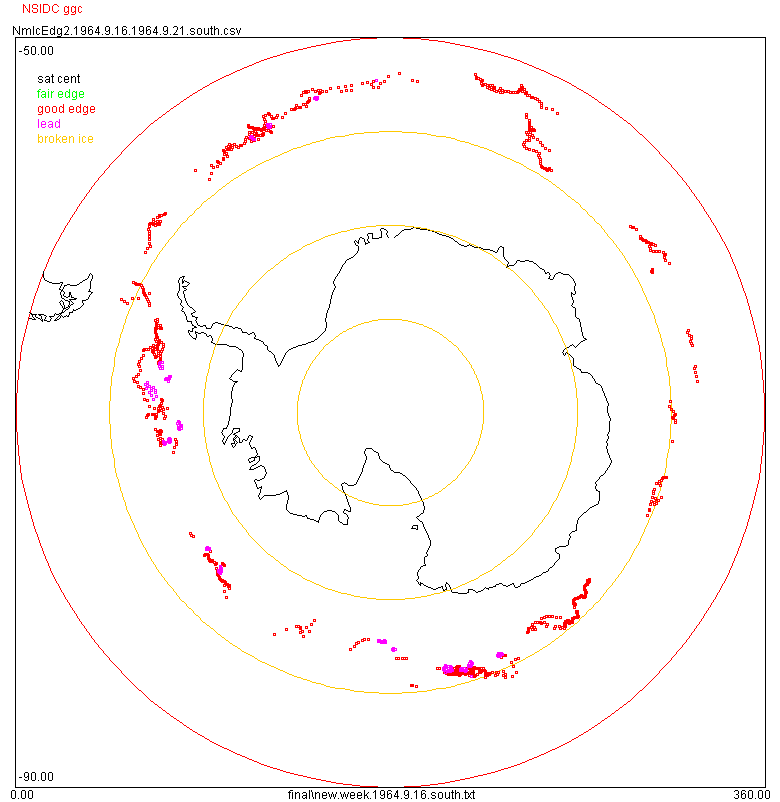
Campbell and a rotating team of students from the University of Colorado Boulder spent approximately four years analyzing the ice images from Nimbus I, II, and III to determine the ice edge and create composite images of both poles. They initially did this manually before Campbell developed a program to automate this process. “Garrett created an algorithm to look at the images and pick out the darkest pixel, which likely is water,” Meier says. “Over a seven day period the ice is there and it’s going to stay there or move around very little, but the ice is not going to get any darker. If you pick the darkest pixel, you’re likely to get the ice and the ocean, but you’re likely not to get cloud. This makes the ice show up much better. Once you have the composite image of the region, you can mark out the ice edge.”
Another challenge for the team was the sheer tedium of entering the hundreds of thousands of time stamps from individual images into an electronic database. “Garrett wrote a brilliant piece of software where if a student could figure out one time in an orbit, they could key that time in,” says Gallaher. “The software was designed to recognize that the images were taken roughly 91 seconds apart. So if the orbit is correct and the timing is correct, this image should show this specific location. The program would then simply inquire if the location shown was what was expected and the student could validate it.”
A final challenge was that the large reel scanners needed to read the Nimbus tapes were no longer being produced. Gallaher and Campbell acquired a Kodak scanner built in 2000 that would do the job. The team still has this scanner, and plans to use it for future data recovery efforts.
Today, NASA's NSIDC DAAC distributes 16 data sets from the Nimbus Data Rescue Project, 15 of which are available in both HDF5 and GeoTIFF format; the Nimbus Ice Edge Points data set is distributed in CSV format. Nimbus data also are available through NASA’s Goddard Earth Sciences Data and Information Services Center (GES DISC).
The Nimbus Time Machine
The Nimbus data recovered by Gallaher, Campbell, and their small team of students is shedding new light on the polar sea ice record—and uncovering some mysteries as well.
“We were shocked by what we discovered in these images,” says Gallaher. “We thought, OK, all reports from the 1960s were that it was colder, so we expected to see a lot more sea ice. In fact, 1964 was the largest sea ice extent until 2014. Then in 1966 we saw the lowest ice extent that was ever seen. This was totally unexpected. There’s a lot more variability in sea ice extent than we ever could have imagined.”
Meier agrees. “Even in the passive microwave record for the Antarctic you see these seesaws where the ice concentrations go up and down, so extreme high or extreme low are not that unusual,” he says. “What the Nimbus data tell us is that there’s variability in the Antarctic sea ice that’s larger than any we had seen from the passive microwave data. Nimbus helps put this in a longer term context and extends the record.”
The Nimbus data from the Arctic also validate the average sea ice concentrations established by the 1979 to 2000 passive microwave record. This is a good indication that the Arctic was fairly stable in the mid-60s and remained stable until about 1979, which is when data indicate that sea ice concentrations began gradually decreasing before a more rapid decline in sea ice began in the 1990s.
And then there’s the mystery of the missing polynya. A polynya is a large area of open water that is surrounded by sea ice. Passive microwave imagery detected a large polynya in the Weddell Sea in Antarctica between 1972 and 1977, but scientists have not seen this feature since. “The data from Nimbus I or II had some indications in the imagery that this polynya might be there to some extent [between 1964 and 1966],” says Meier. “There are signs of open water in this area, but it’s not totally clear. Was this a glitch? Or was this a feature that persisted from the 1960s into the 1970s and then faded away? We don’t have the imagery to prove this conclusively, but there are indications in the [Nimbus] imagery.”
Looking Ahead by Looking Back
For sea ice researchers like Meier, the recovered Nimbus data open up many avenues for new research. “The Nimbus data give a longer term context of the sea ice record,” he says. “We might say a year is a record year, but we’re really only talking about the years covered by the passive microwave record. Now we can take into account the Nimbus data record.”
Gallaher points out that the Nimbus data also will aid in climate modeling. “If you’re trying to build a climate model you now have access to 50 years of data. This will improve the accuracy of these models quite a bit,” he says. “One thing I’ve been advocating is to run these models backwards. If you can predict what we saw [in the Nimbus data], you now have handled all the extraneous characteristics of what was there [in the 1960s] and what has changed. This would be an excellent validation of these models. If you can predict back 20 years, you can predict forward 20 years or longer.”
While Gallaher and Campbell concentrated on sea ice, Nimbus has other data that also can be used for research. “The potential exists to get sea surface temperature, cloud distributions, tropical storm images,” Campbell says. “We have not really mined the data for all the possible uses. We’ve just focused on sea ice since this is our area of interest at NSIDC.”
The Nimbus Data Rescue Project remains a popular NSIDC DAAC data set, with the Nimbus Advanced Vidicon Camera System Visible Imagery L1 and the High Resolution Infrared Radiometer Digital Swath Data L1 being the two most heavily downloaded products, based on NSIDC volume metrics from 2015 and 2016.
In addition, the Nimbus Data Rescue Project received the 2013 International Data Rescue Award in the Geosciences. This award, presented by Integrated Earth Data Applications and Elsevier Research Sciences, encourages improvements in the preservation and access of research data, particularly data that have not been analyzed or processed.
And there are more dark data out there.
Gallaher and Campbell currently are organizing the rescue of data from the Environmental Science Services Administration (ESSA) Satellite Program, specifically the ESSA 1, 3, 5, 7, and 9 missions, which launched between 1966 and 1969 and provided sea ice data similar to Nimbus. They also want to attempt a rescue of data from NOAA-2, which launched in 1972 and was the first operational weather satellite to rely solely on radiometric imaging to obtain cloud cover data.
Gallaher, Campbell, and Meier note that there are some good lessons from the Nimbus data recovery effort. “Nimbus is a lesson in don’t throw anything away,” Meier says. “The longer-term context that the Nimbus data provide is really valuable and useful for the science community.”
Gallaher agrees, and notes that if they had not acted when they did, the Nimbus data may have been lost forever. “These canisters were held together with cloth tape, so when you open the canisters the tape disintegrates into dust,” he recalls. “You’re opening these things up and it’s odd to think about how old this stuff is. We’re the first ones to really look at these data. There are some amazing images. It really was man’s first look at our own planet.”
A first look that is finally seeing the light of day.
Explore NASA Nimbus Data
Nimbus data at NASA's NSIDC DAAC: http://nsidc.org/data/nimbus/data-sets.html
Nimbus Data Rescue Project: http://nsidc.org/data/nimbus
Nimbus data at NASA's GES DISC: http://disc.sci.gsfc.nasa.gov/nimbus
Earthdata Webinar -- Satellite Techno-Archeology: Old Data Answers New Questions
Blumenfeld is an EOSDIS science writer. This article originally was published on the Earthdata website on June 23, 2016: https://earthdata.nasa.gov/new-data-from-old-satellites-a-nimbus-success-story.